HCM Analytics
internal Mobility
Quick Tip: Watch this short tutorial to see the HCM Dashboard in action.
Overview
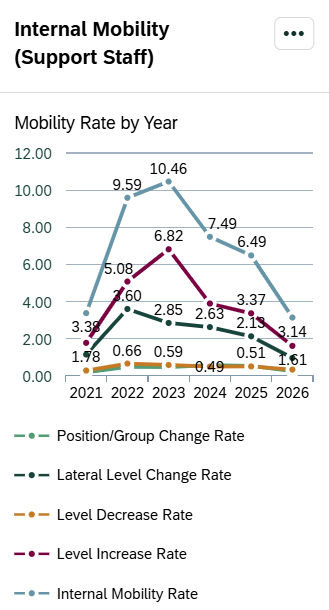
The Internal Mobility Card measures the percentage of regular benefit-eligible Support Staff employees who move from one regular benefit-eligible primary job to another regular benefit-eligible primary job within Michigan State University during a fiscal year (July 1 – June 30).
This metric is intended to measure meaningful employee movement within the university and provide insight into career progression and talent mobility. Exploring where employees move can also help organizations understand whether they are retaining employees within their own organizational unit or MAU by providing opportunities for growth, or whether employees are moving to other areas of the university.
Internal Mobility is categorized into four types of movement:
- Level Increase
- Level Decrease
- Lateral
- Position/Group Change
Most internal mobility occurs through the university's job posting process, when employees apply for and move into other positions within MSU.
Key Metrics & Definitions
> Internal Mobility Rate
-
- The percentage of regular benefit-eligible Support Staff employees who move from one regular benefit-eligible primary job to another within MSU during the fiscal year.
| Internal Mobility Rate = |
# of distinct regular benefit-eligible support staff employees who move from one
regular benefit-eligible primary job to another regular benefit-eligible primary job
between 7/1 and 6/30
average # of benefit-eligible support staff employees that fiscal year* |
Note: The overall Internal Mobility rate counts distinct employees, so each employee is counted only once regardless of how many qualifying movements they experienced during the fiscal year. The drilldown, however, displays individual qualifying movements. Employees with multiple qualifying movements during the fiscal year may appear more than once in the Drilldown Page.
*Average # of Benefit Eligible Support Staff Employees:
| *Average # of benefit eligible employees = |
# of active/inactive support staff employees on 7/1 +
# of active/inactive support staff employees on 6/30
2 |
> Movement Types
Each qualifying movement is categorized into one of the following movement types:
-
- Level Increase: An employee moves from a regular benefit-eligible primary job to another regular benefit-eligible primary job at a higher job level, either within the same personnel subarea or across AP, APSA, or CT personnel subareas. ( Example: AP Level 12 to APSA Level 13)
- Level Decrease: An employee moves from a regular benefit-eligible primary job to another regular benefit-eligible primary job at a lower job level, either within the same personnel subarea or across AP, APSA, or CT personnel subareas. ( Example: AP Level 10 to CT Level 9)
- Lateral: An employee moves from a regular benefit-eligible primary job to another regular benefit-eligible primary job at the same job level. This may involve a change in role, responsibilities, department, or organizational unit without a change in job level. ( Example: AP Level 10 to AP Level 10)
- Position/Group Change: An employee moves from one regular benefit-eligible primary job to another regular benefit-eligible primary job that does not meet the criteria for a level increase, level decrease, or lateral level change. This category captures other qualifying position changes, such as changes in job classification or roles that cannot be categorized based on job level alone. ( Example: Support Staff to Academic Staff or movement to another personnel subarea outside of transfers within AP, APSA, and CT.)
> What Is Not Considered a Qualifying Movement?
Not all changes to an employee's job or organizational assignment qualify as internal mobility. The metric focuses on substantive changes to an employee's primary job assignment rather than administrative or organizational changes.
Examples of changes that are excluded include:
-
- Reorganizations
- Reclassifications
- Bypass/Bumping
- Interim Assignments
- Pay Changes
Important: A qualifying movement must reflect a change from one regular benefit-eligible primary job to another within MSU.
Security & Access
The Internal Mobility Card is available to users with the following roles:
- Report Administrator
- Report Administrator Sensitive
Org-based security applies to the Internal Mobility metric. Users will only see movements for employees whose previous organizational assignment falls within the organizations they are permissioned to access. This means that users can see employees moving from their organization to another organizational unit or MAU elsewhere at MSU, but they will not see employees moving into their organization from an area outside their access.
For example, if a report administrator has access to MAU A, the following movements would be visible:
|
Previous Organization |
New Organization |
Visible? |
| MAU A | Another unit within MAU A | Yes |
| MAU A | MAU B or another area of MSU | Yes |
| MAU B or another area of MSU | MAU A | No |
Keep in mind: Access is based on the employee's organizational assignment prior to the movement, not their new assignment.
Drilldown Page
Select any data point within the card to open the drilldown page for that fiscal year. To view a different fiscal year, adjust the Fiscal Year filter at the top of the page.
> Filters
The following filters can be applied on the drilldown page. Click 'Go' to apply your selections.
|
Visible by Default |
Available through 'Adapt Filters' |
*Required filter |
|
> Default Views
-
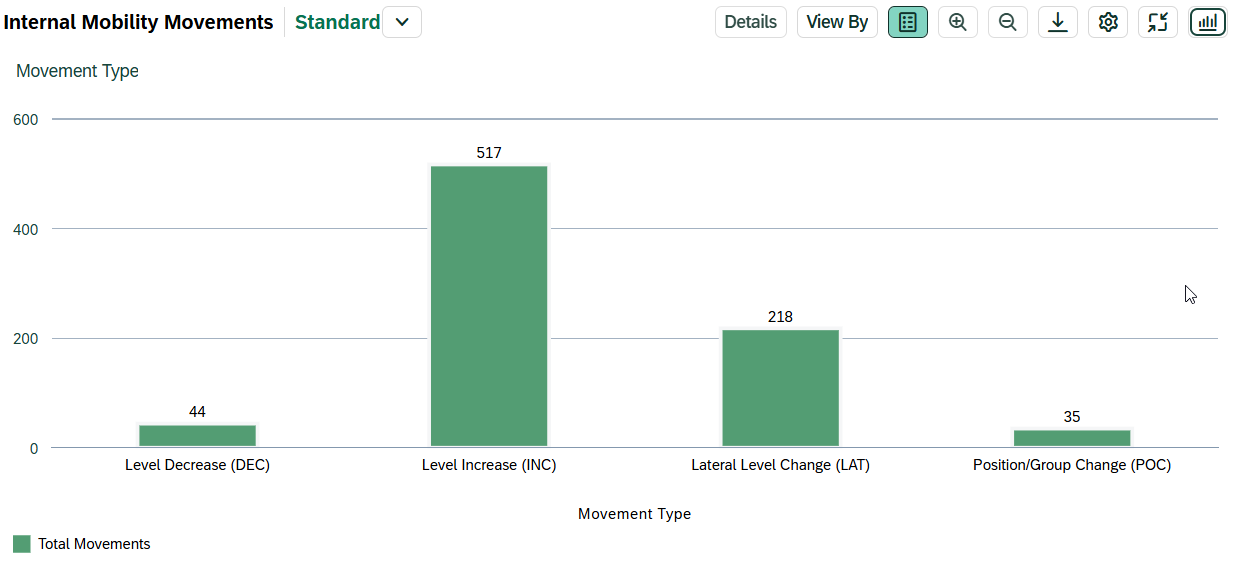
- Chart View: Displays the number of movements by Movement Type in a column chart.
-
- Table View: Displays the following fields by default:
|
Visible by Default |
Available through 'Settings' |
|
|
|
|
> Customizing Your View
You can personalize the chart and table to better align with your analysis needs. Click the gear icon to add, remove, or reorder dimensions. For a brief walkthrough, see the Customizing & Saving Views video.

Available dimensions include:
|
|
|
> Exploring Organizational Movement & Retention
The table view provides details about individual employee movements, including previous and new job assignments. Reviewing new job titles organizational assignments can help you understand the types of career opportunities employees are pursuing, where employees are finding opportunities across MSU, and how talent is moving throughout the university.
> Exploring Organizational Retention & Outflow
To understand whether employees are moving within or outside of their current organization, customize the chart view to include MAU Changed? or Org Changed as a dimension. These fields allow you to see how employee movements are distributed based on whether the employee's MAU or organizational unit changed.
For example, this view can help an MAU understand whether employees pursuing new opportunities are generally staying within the MAU or moving to another MAU. This provides additional insight into how effectively the organization is retaining employees through internal opportunities.
Interpreting the Data
Impact of Job Postings
The number of available job postings can influence the Internal Mobility rate from year to year. When fewer positions are posted, employees may have fewer opportunities to move into other roles within MSU, which can contribute to a lower Internal Mobility rate. Changes in the rate should be considered in the context of hiring activity and available internal opportunities.
Other Considerations
Please review the Interpreting the Data section on the main dashboard help page. It highlights key considerations—such as effective dates and organizational changes—that may influence results.